1: Exploding engagement with saving and investing firms is leading to new all-time highs in numbers of consumer relationships at multiple firms. With 1 in 4 households holding assets at 4+ firms, average share of wallet (SOW) fell to 37%.
1.1: Exhibit 1.1 — Saving & Investing Relationships per Household, Select Ranges: National, by Year
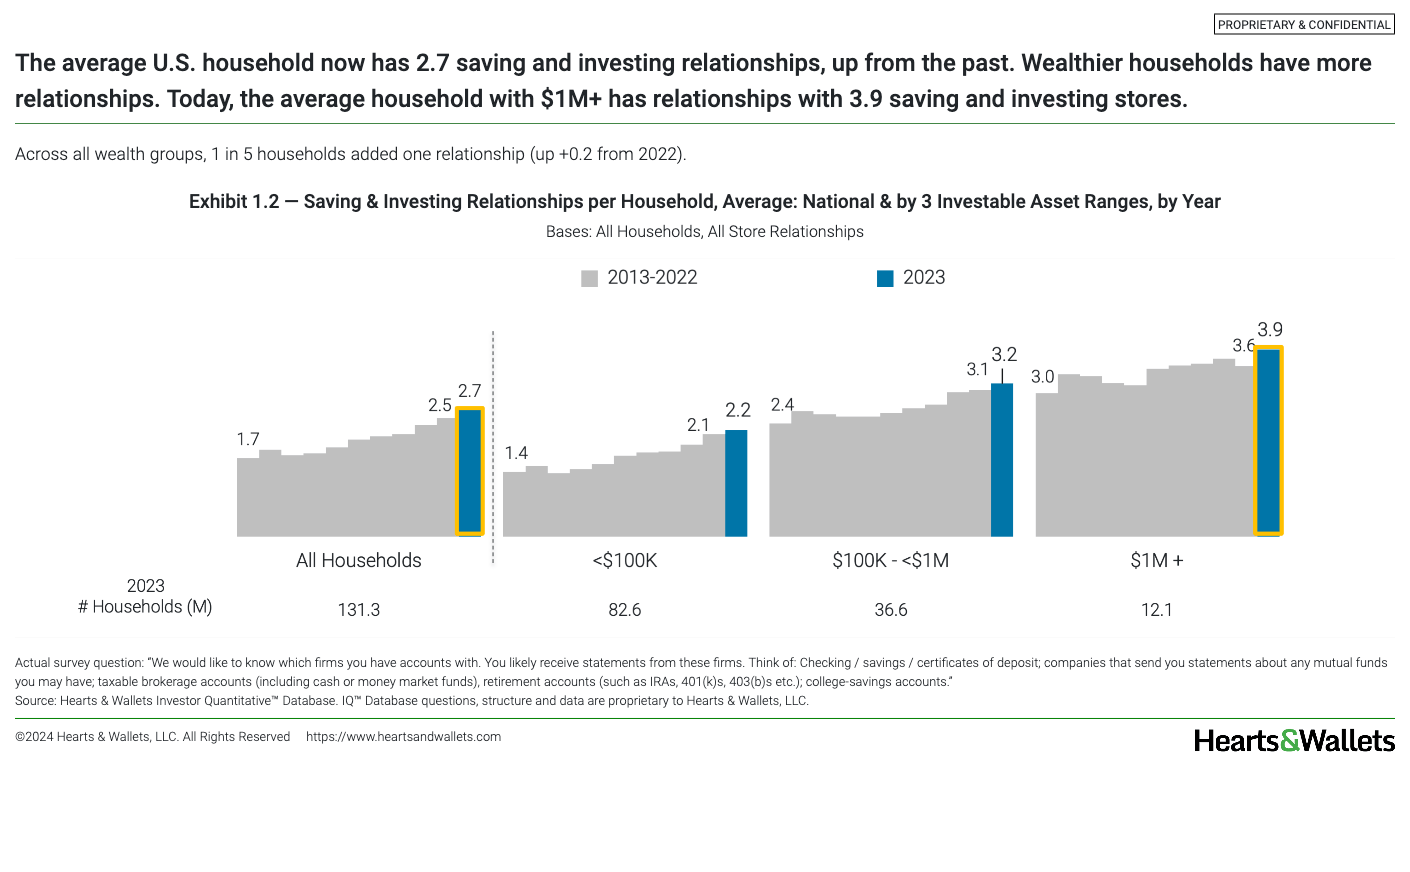
1.2: Exhibit 1.2 — Saving & Investing Relationships per Household, Average: National & by 3 Investable Asset Ranges, by Year
1.3: Exhibit 1.3 — Saving & Investing Relationships per Household, Reduced Full Range: National, by Year
1.4: Exhibit 1.4 — Saving & Investing Relationships per Household, Reduced Full Range: by 3 Investable Asset Ranges, by Year
1.5: Exhibit 1.5 — Total U.S. Saving & Investing Relationships and Total U.S. Households: by Year
1.6: Exhibit 1.6 — Share of Wallet, Industry Average: by Investable Assets, by Year
1.7: Exhibit 1.7 — Saving & Investing Relationships per Customer, Average: by Store, by Year
1.8: Exhibit 1.8 — Saving & Investing Relationships per Customer, 4+: by Store, 2023
2: As consumers spread their assets across more stores, household penetration is rising for almost all the biggest firms, as well as select others. But lasting gains in competitive position and share of relationships are elusive, even for the biggest firms.
2.1: Exhibit 2.1 — Household Penetration, All Saving & Investing Relationships, Top 10 Stores: National, by Year
2.2: Exhibit 2.2 — Household Penetration, All Saving & Investing Relationships, Other Stores: National, by Year
2.3: Exhibit 2.3 — Top 5 Stores for Household Penetration in Each Investable Asset Range, by Year
2.4: Exhibit 2.4 — Household Penetration, All Saving & Investing Relationships, Top Stores: by <$100K Investable Assets, by Year
2.5: Exhibit 2.5 — Household Penetration, All Saving & Investing Relationships, Top Stores: by $100K-<$1M Investable Assets, by Year
2.6: Exhibit 2.6 — Household Penetration, All Saving & Investing Relationships, Top Stores: by $1M+ Investable Assets, by Year
2.7: Exhibit 2.7 — Share of All Saving & Investing Relationships, Top Stores: National, by Year
3: Earning the role of primary store, or highest share of wallet, is more challenging in the intensified competitive environment. Select leaders rise above the pack.
3.1: Exhibit 3.1 — Primacy Rate: Industry Average, by Year
3.2: Exhibit 3.2 — Primacy Rate: by Store, 2023
3.3: Exhibit 3.3 — Primacy Rate: by Store, by Year
3.4: Exhibit 3.4 — Customer Relationship Level: by Store, 2023
3.5: Exhibit 3.5 — Share of Wallet, Average: by Store, 2023
3.6: Exhibit 3.6 — Share of Wallet, Average: by Store, by Year
3.7: Exhibit 3.7 — Share of Wallet, Ranges: by Store, 2023
3.8: Exhibit 3.8 — Share of Wallet Among Customers With $1M+ Investable Assets, Average: by Store, by Year
3.9: Exhibit 3.9 – Share of U.S. Consumer Investable Assets, Top Stores, by Year
3.10: Exhibit 3.10 — Share of U.S. Consumer Investable Assets, by Investable Asset Ranges, Top Stores, by Year
4: About half of primary/secondary relationships are high trust, with notable long-term improvement in workplace-based relationships. At the industry level, customer intent to recommend current stores is up, but intent to invest more is flat nationally, with a big drop among households with $1M+.
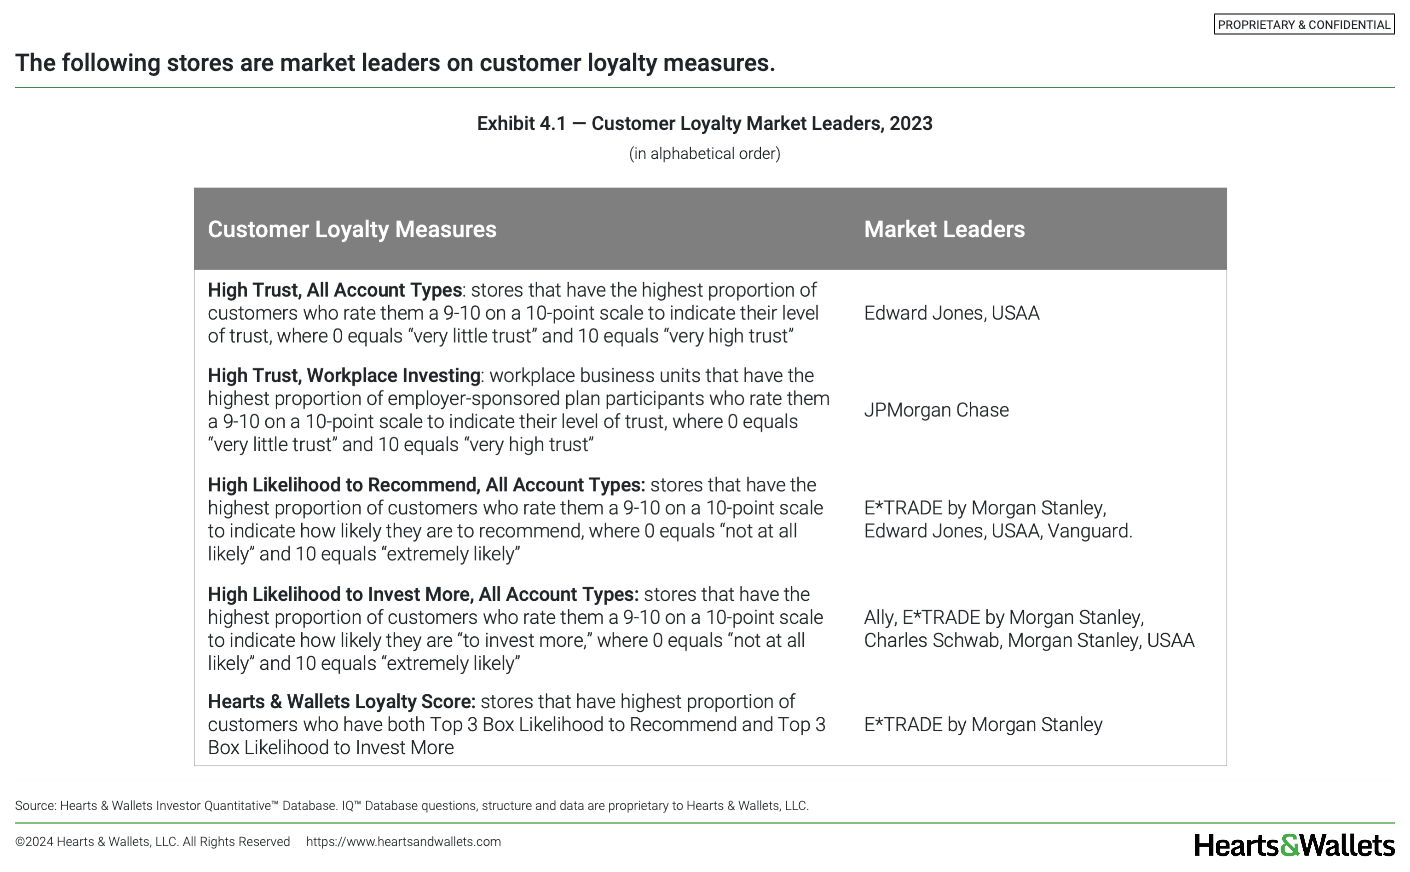
4.1: Exhibit 4.1 — Customer Loyalty Market Leaders, 2023
4.2: Exhibit 4.2 — Trust, Top 2 Box (9-10): by Investable Assets, by Year
4.3: Exhibit 4.3 — Trust, Top 2 Box (9-10): by Generation, by Year
4.4: Exhibit 4.4 — Trust, All Levels: by Store, 2023
4.5: Exhibit 4.5 — Trust, Top 2 Box (9-10): by Store, by Year
4.6: Exhibit 4.6 — Trust, Top 2 Box (9-10): by Account Types, by Year
4.7: Exhibit 4.7 — Trust, Top 2 Box, Workplace Investing: by Age Ranges, by Year
4.8: Exhibit 4.8 — Trust, Top 2 Box, Workplace Investing: by Store, 2023
4.9: Exhibit 4.9 — Trust, Top 2 Box, Workplace Investing: by Store, by Year
4.10: Exhibit 4.10 — Likelihood to Recommend, Top 2 Box (9-10): by Investable Assets, by Year
4.11: Exhibit 4.11 — Likelihood to Recommend, All Levels: by Store, 2023
4.12: Exhibit 4.12 — Likelihood to Recommend, Top 2 Box (9 -10): by Store, by Year
4.13: Exhibit 4.13 — Likelihood to Invest More, Top 2 Box (9-10): by Investable Assets, by Year
4.14: Exhibit 4.14 — Likelihood to Invest More, All Levels: by Store, 2023
4.15: Exhibit 4.15 — Likelihood to Invest More, Top 2 Box (9-10): by Store, by Year
4.16: Exhibit 4.16 — Hearts & Wallets Loyalty Score: by Store, 2023
5: Customers who are covered in experience models that deliver both advice and service on Inside Advice® Grid are more likely to use those stores as main source of retirement advice and grant them higher share of wallet.
5.1: Exhibit 5.1 — Share of Wallet, Average, All Stores: by Main Source of Retirement Advice, by Year
5.2: Exhibit 5.2 — Serve as Main Source of Retirement Advice: National, by Year
5.3: Exhibit 5.3 — Customers Using as Main Source of Retirement Advice: by Store, 2023
5.4: Exhibit 5.4 — Customers Using as Main Source of Retirement Advice: by Store, 2021-2023
5.5: Exhibit 5.5 — Connections Between Main Source of Retirement Advice and Primary Store, 2023
5.6: Exhibit 5.6 — Customers Using as Main Source of Retirement Advice: by Customer-Reported Inside Advice® Grid Coverage, 2023
5.7: Exhibit 5.7 — Customers Using Store as Main Source of Retirement Advice: by Customer-Reported Inside Advice® Grid Category, 2023
5.8: Exhibit 5.8 — Share of Wallet, Selected Ranges: by Customer-Reported Inside Advice® Grid Category, 2023
5.9: Exhibit 5.9 — Coverage by Customer-Reported Inside Advice® Grid Category, 2023
5.10: Exhibit 5.10 — Coverage by Customer-Reported Inside Advice® Grid Category: Industry, 2020-2023
5.11: Exhibit 5.11 — Coverage by Customer-Reported Inside Advice® Grid Category: Bank of America, 2021-2023
5.12: Exhibit 5.12 — Coverage by Customer-Reported Inside Advice® Grid Category: Ameriprise, 2021-2023
5.13: Exhibit 5.13 — Coverage by Customer-Reported Inside Advice® Grid Category: Robinhood, 2021-2023


